Menu
Physics Lesson 22.4.4 - The Hertzsprung-Russell Diagram
Please provide a rating, it takes seconds and helps us to keep this resource free for all to use
Welcome to our Physics lesson on The Hertzsprung-Russell Diagram, this is the fourth lesson of our suite of physics lessons covering the topic of Stars, you can find links to the other lessons within this tutorial and access additional physics learning resources below this lesson.
The Hertzsprung-Russell Diagram
In astronomy, Hertzsprung-Russell diagram, also called H-R diagram, is a graph in which the luminosity values of stars (shown in the vertical axis) are plotted against their temperatures (shown in the horizontal axis). It is a bit different from normal diagrams as the values of absolute magnitudes increase from right to left in a logarithmic fashion.
In this diagram, stars are shown with dots. In this way, a landscape with coloured dots is produced, as shown in the figure below.
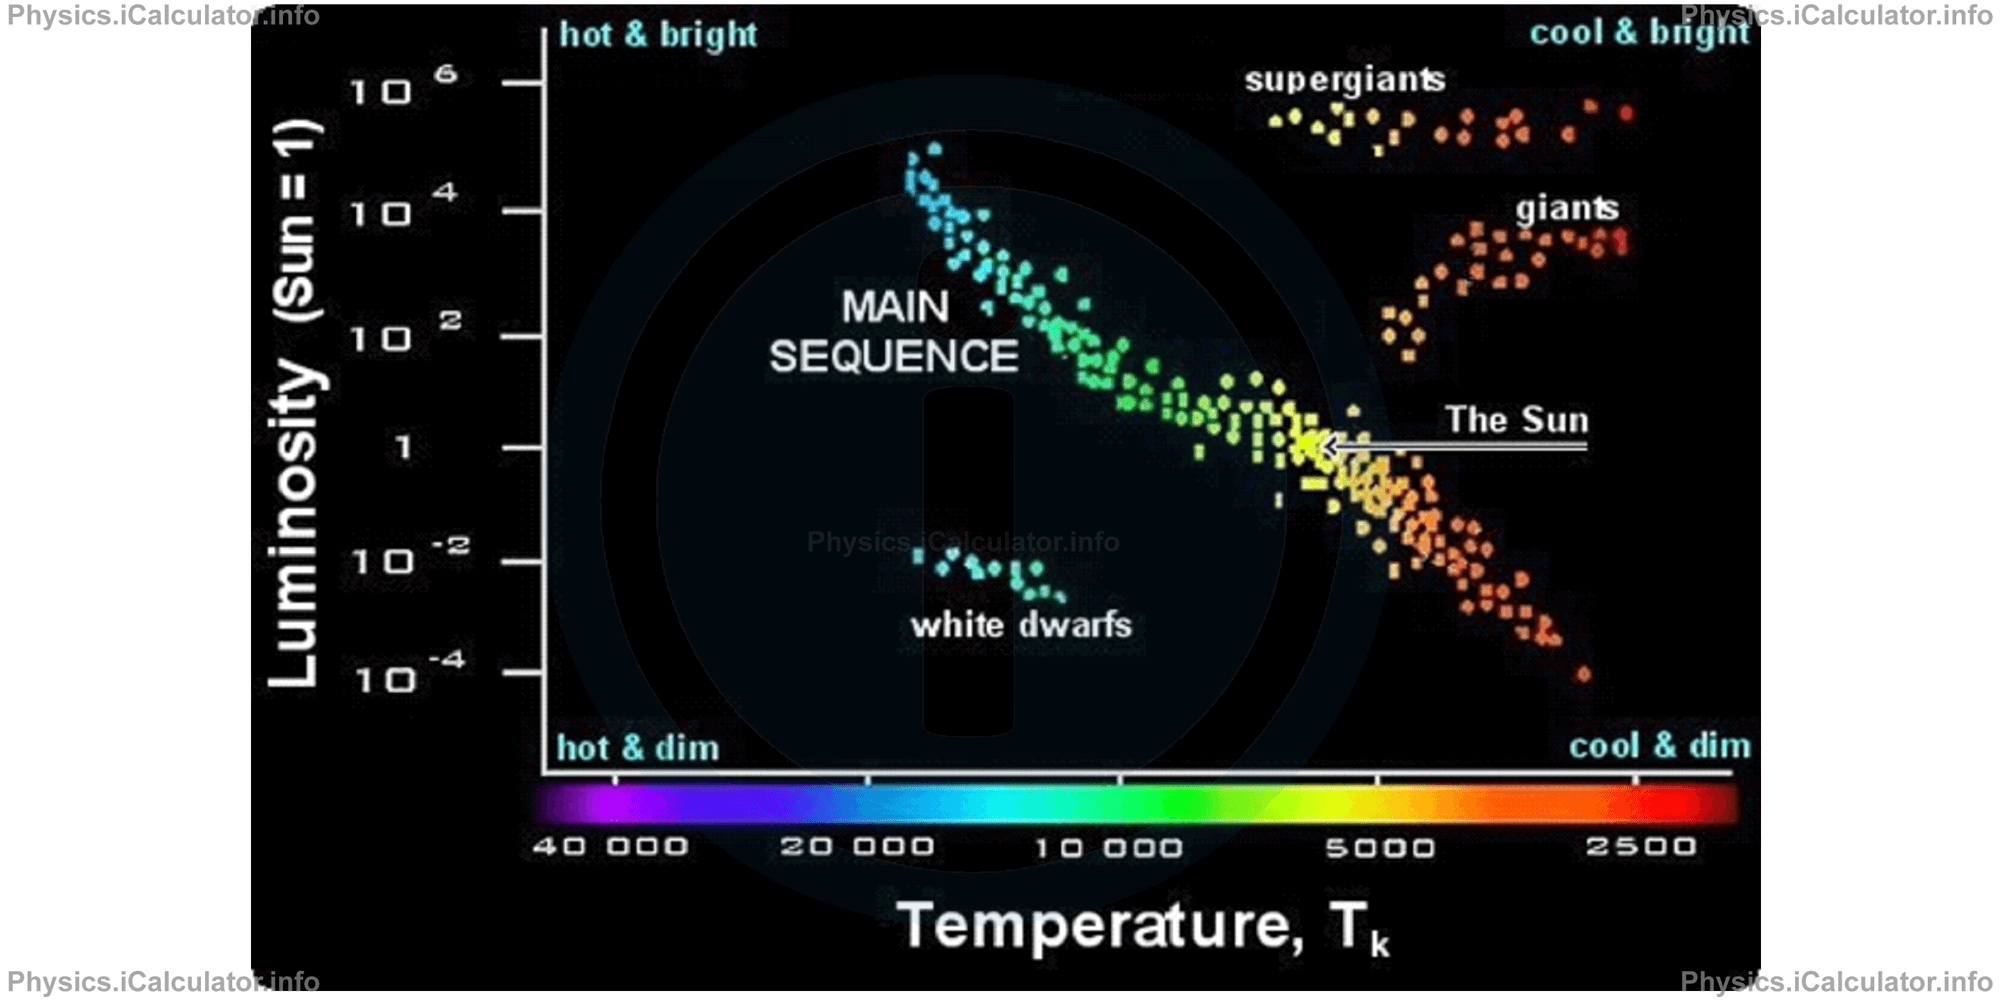
From the above diagram, we can identify four main sections with stars in different stages of their life.
1. Main sequence stars
This is a zone which includes most stars of the Universe because they are in the longest and most stable stage of their life. This zone includes many stars, from the hottest and brightest (top-left) to the coldest and dimmest (bottom-right). This zone contains our Sun as well. Moreover, it lies in the middle of this zone, which is further proof that the Sun is one of the most common stars of the Universe.
The Main sequence stars includes those stars in which the fusion reaction that converts hydrogen to helium takes place. The mass of stars determines their position in the diagram. The heaviest stars of this zone lie in the top-left part of diagram while the lightest ones lie in the bottom-right. Most stars of this zone are in the bottom-right part of this zone.
Main sequence stars zone includes about 90% of stars in the Universe. Hence the name "main sequence stars" for this zone.
2. (Red) giant stars
This zone lies in the top-right section of main sequence stars and includes relatively cool stars that emit high amounts of radiation due to their large dimensions. The range of temperatures of red giant stars varies from 3000 K to 6000 K, i.e. in most cases it is below the Sun temperature (5800 K).
The high radiation produced by red giants is due to their very large dimensions rather than high temperatures. The radius of red giants can be up to 200 times greater than the radius of the Sun. Therefore, the large dimensions compensate in a certain sense for the lower temperatures, as the amount of radiation is proportional to the surface of the radiating object, i.e. to the square of radius. Moreover, the high-energy flux originating from such a large surface lowers the temperature as the flux of radiation in unit area reduces (recall Stefan-Boltzmann Law P = σ · A · T4 where P is the power of radiation, that is the energy of radiation in unit time).
Since the temperature of a radiating object is inversely proportional to wavelength of EM radiation emitted, the decrease in temperature in red giants brings an increase in wavelength, making the colour of star shift towards red, which represents the colour with the largest wavelength in the visible spectrum.
Nuclear reactions that take place in red giants are different from those occurring in the main sequence stars. The most common reaction in red giants involves helium burning to produce carbon.
3. Red super giants
These stars are older than red giants as they have completed the cycle of helium-to-carbon conversion and now are in the stage of carbon burning to produce heavier elements such as oxygen and other chemical elements up to iron, where the conversion process terminates. Red super giants lie above red giants in Hertzsprung-Russell Diagram. This means they radiate even higher amounts of energy because the radius of these stars may extend up to a few thousand times the solar radius.
4. White dwarfs
These stars appear in the bottom-left zone of Hetrzsprung-Russell diagram. This means their temperature is very high but their brightness is very dim. The surface temperature of such stars is about 10 000 K and their radius is not more than a few thousand kilometres, i.e. about 100 times smaller than the radius of Sun. Hence, their low brightness is not because of colour but of their small dimensions.
White dwarfs have very high densities reaching one billion times water density. No nuclear reactions occur in white dwarfs. The mass of white dwarfs is close to that of the Sun but they never exceed the value of 1.4 times the solar mass.
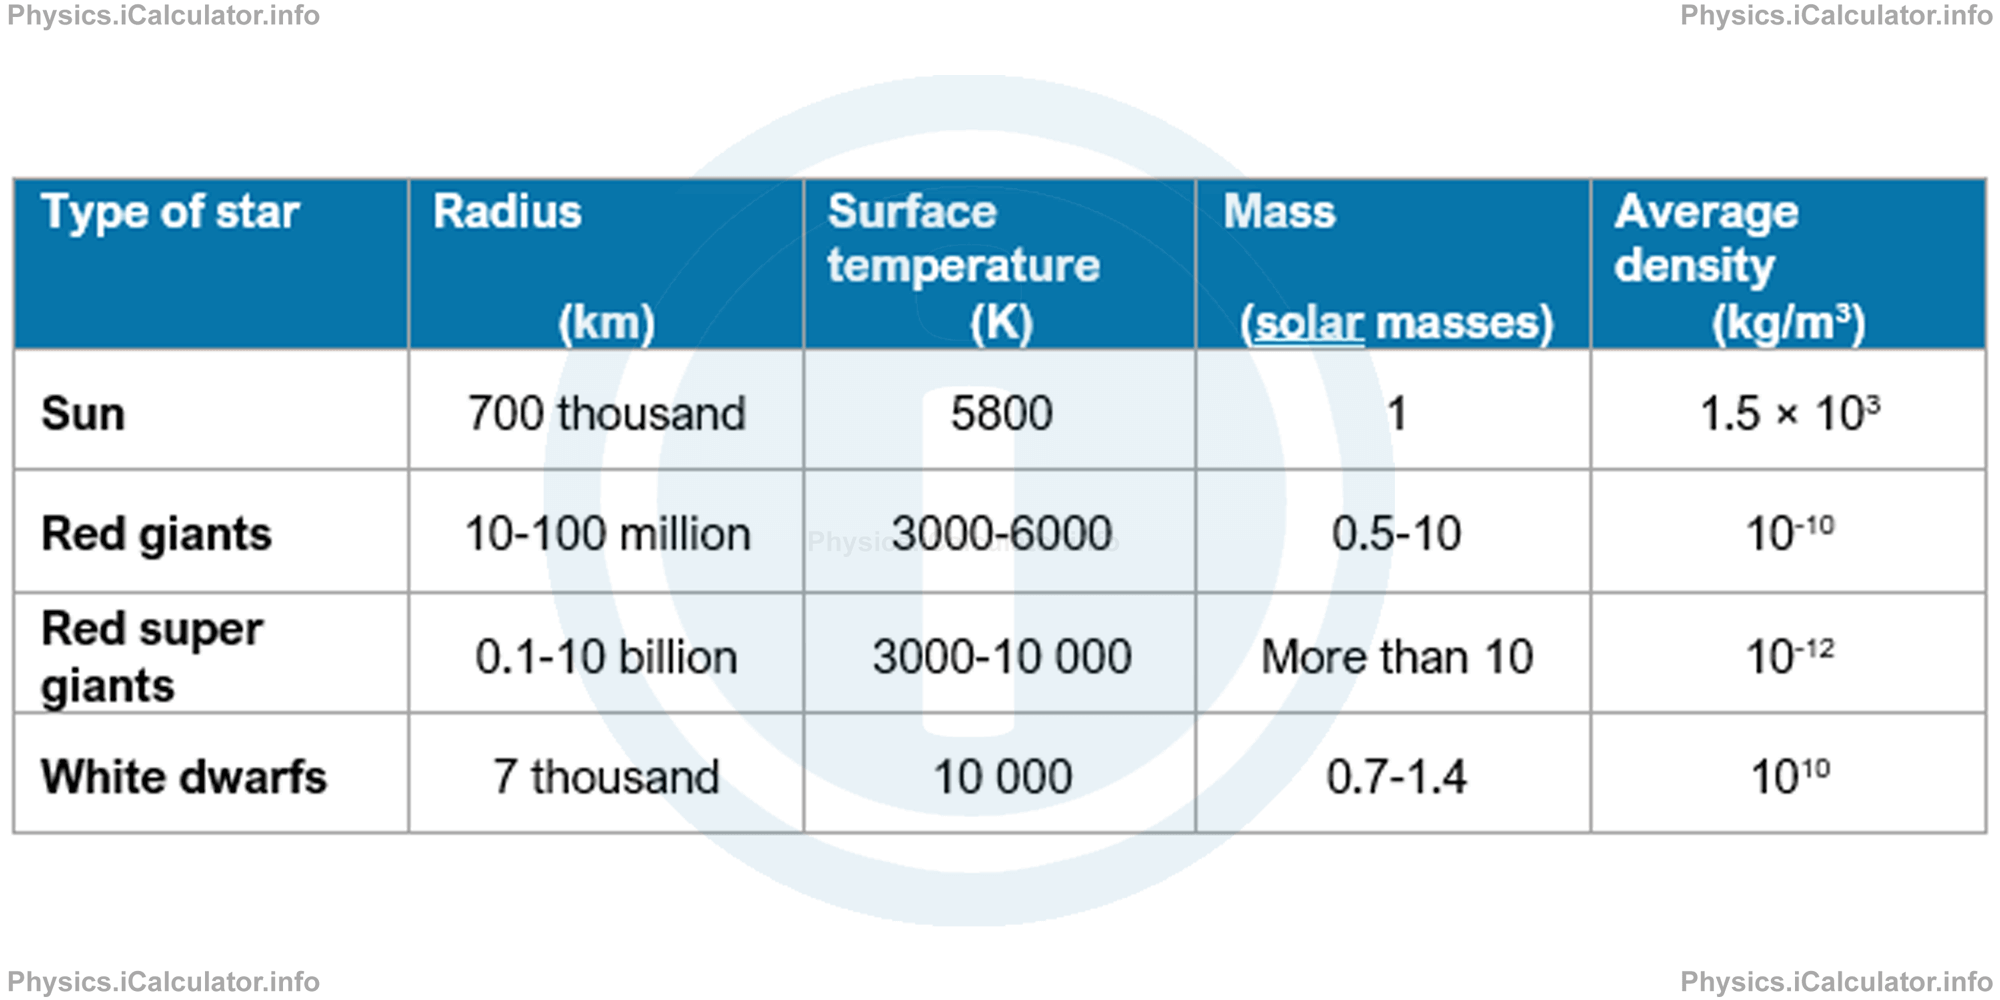
The following table summarizes a few important features of the there above categories of stars and those of the Sun in a separate row.
You have reached the end of Physics lesson 22.4.4 The Hertzsprung-Russell Diagram. There are 5 lessons in this physics tutorial covering Stars, you can access all the lessons from this tutorial below.
More Stars Lessons and Learning Resources
Whats next?
Enjoy the "The Hertzsprung-Russell Diagram" physics lesson? People who liked the "Stars lesson found the following resources useful:
- Hertzsprung Russell Diagram Feedback. Helps other - Leave a rating for this hertzsprung russell diagram (see below)
- Cosmology Physics tutorial: Stars. Read the Stars physics tutorial and build your physics knowledge of Cosmology
- Cosmology Revision Notes: Stars. Print the notes so you can revise the key points covered in the physics tutorial for Stars
- Cosmology Practice Questions: Stars. Test and improve your knowledge of Stars with example questins and answers
- Check your calculations for Cosmology questions with our excellent Cosmology calculators which contain full equations and calculations clearly displayed line by line. See the Cosmology Calculators by iCalculator™ below.
- Continuing learning cosmology - read our next physics tutorial: Evolution of Stars
Help others Learning Physics just like you
Please provide a rating, it takes seconds and helps us to keep this resource free for all to use
We hope you found this Physics lesson "Stars" useful. If you did it would be great if you could spare the time to rate this physics lesson (simply click on the number of stars that match your assessment of this physics learning aide) and/or share on social media, this helps us identify popular tutorials and calculators and expand our free learning resources to support our users around the world have free access to expand their knowledge of physics and other disciplines.