Menu
Physics Lesson 3.10.4 - Speed verse Time graph in Uniformly Accelerated (Decelerated) Motion
Please provide a rating, it takes seconds and helps us to keep this resource free for all to use
Welcome to our Physics lesson on Speed verse Time graph in Uniformly Accelerated (Decelerated) Motion, this is the fourth lesson of our suite of physics lessons covering the topic of Velocity v's Time and Speed v's Time Graph, you can find links to the other lessons within this tutorial and access additional physics learning resources below this lesson.
Speed verse Time graph in Uniformly Accelerated (Decelerated) Motion
Like in the distance vs time graph, the speed vs time graph is similar to the velocity vs time graph when the acceleration (slope) is positive. On the other hand, in the part of the graph in which the slope is negative (where the acceleration is negative), the graph is obtained by flipping vertically the corresponding section of the velocity vs time graph, as shown below.
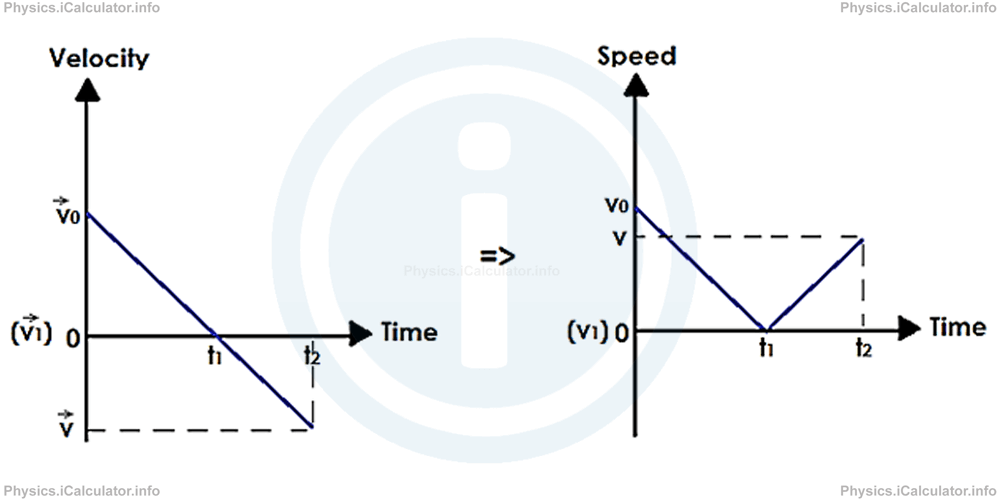
The second graph (the speed vs time graph) does not provide any information on the direction of motion; it only shows that the object first decelerates until it stops, then it accelerates. This may either occur when the object changes direction or when it only slows down, stops and accelerates again at the same direction. Therefore, the velocity vs time graph is more comprehensive than the corresponding speed vs time graph.
Example
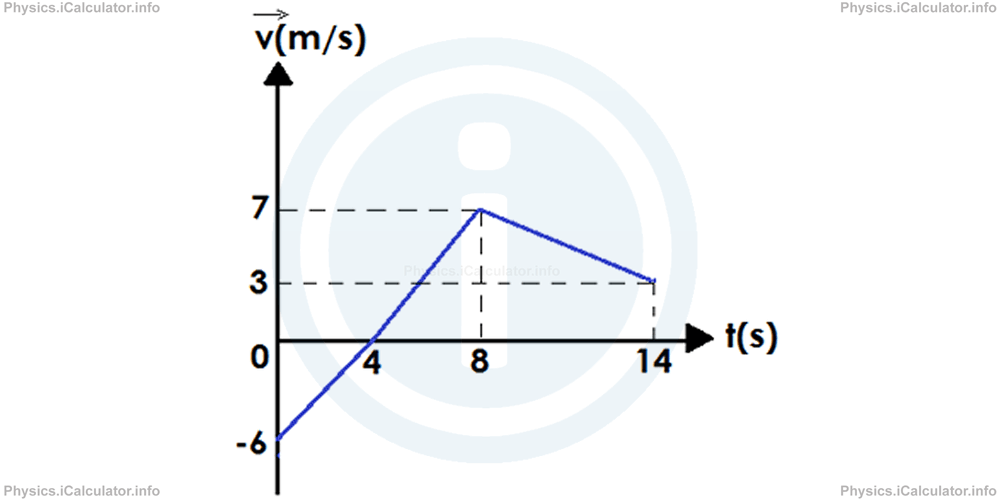
The velocity vs time graph for a moving object is shown in the figure below.
- Calculate the acceleration in the first 4 seconds
- Calculate the acceleration in the interval (4s - 8s)
- Calculate the acceleration in the interval (8s - 14s)
- Calculate the displacement in the first 4 seconds
- Calculate the displacement in the interval (4s - 8s)
- Calculate the displacement in the interval (8s - 14s)
- Calculate the total displacement of the object
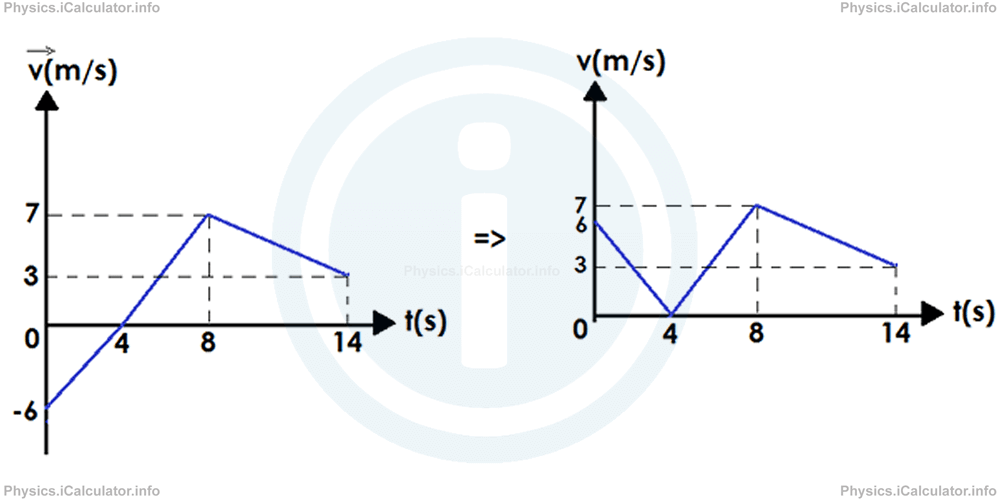
- Plot the corresponding speed vs time graph for the entire motion
Solution
From the graph, we can extract the following values during the first 4 s:
v⃗1 = 0
t1 = 4s
Thus, we have
As you see, the acceleration is positive although the object is slowing down. This is because it is moving in the negative part of coordinates and slowing down in the negative part of coordinates has the same effect as speeding up in the positive one.
In the following 4 s (from 4s to 8s) we have:
v⃗2 = 7 m/s
t2 = 8s - 4s = 4s
Therefore,
In the third interval (from 8s to 14s) we have:
v⃗3 = 3 m/s
t3 = 14 s - 8 s = 6 s
Hence, we have
The displacement in the first 4s is obtained by calculating the magnitude of the corresponding area of the figure, i.e.
The displacement in the next 4s (from 4s to 8s) is obtained by calculating the magnitude of the corresponding area of the figure, i.e.
The displacement in the last 6s (from 8s to 14s) is obtained by calculating the corresponding area of figure, i.e.
The total displacement therefore, is obtained by adding all the previous displacements
= -12 m + 14m +30m
= 32m
The speed vs time graph differs from the velocity vs time graph only in the negative part (the graph is flipped vertically). Thus,
How to plot the Position vs Time graph when the corresponding Velocity vs Time graph is given?
First, let's take a simple velocity vs time graph to explain this idea and then we will deal with more complicated graphs.
Example 2
An object starts moving from x⃗0 = 12 m. Its velocity vs time graph is shown below.
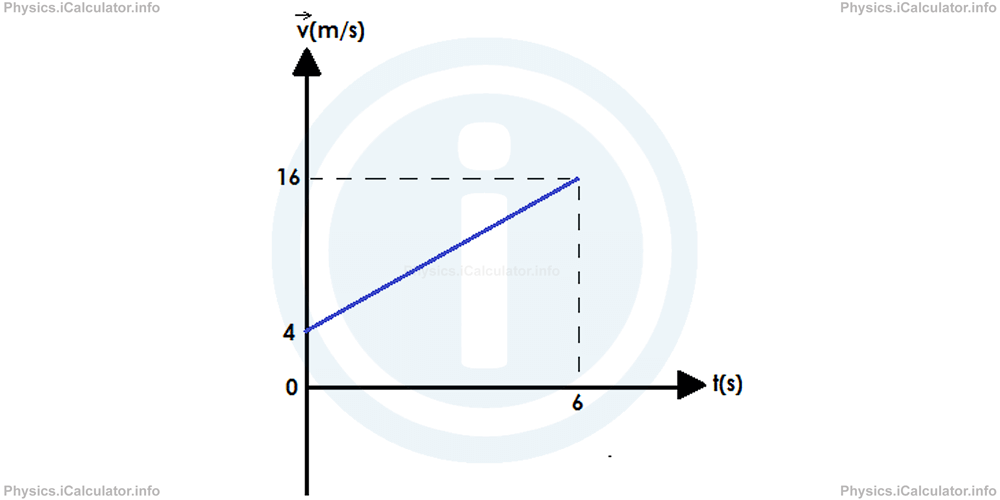
Plot the corresponding Position vs Time graph for this motion.
Solution 2
The graph shows a uniformly accelerated motion where v⃗0 = 4 m/s, v⃗ = 16 m/s, t = 6s and x⃗0 = 12m. From these clues, we can calculate the acceleration a⃗ for this motion. Thus,
Thus giving that the equation of motion with constant acceleration is a quadratic equation of the type
where
B = v⃗0 = 4
C = x⃗0 = 12
x = t (the independent variable)
we obtain after the substitutions
Or
The graph of this quadratic function is a parabola. Therefore, we need to find several values in order to plot an accurate graph. These values are obtained by substituting t by 0, 1, 2, 3, 4, 5 and 6 respectively. The following table shows the results obtained.
| Time t (s) | 0 | 1 | 2 | 3 | 4 | 5 | 6 |
|---|---|---|---|---|---|---|---|
| Position x (m) | 12 | 17 | 24 | 33 | 44 | 57 | 72 |
Now, let's insert these points in the position vs time graph and connect them smoothly.
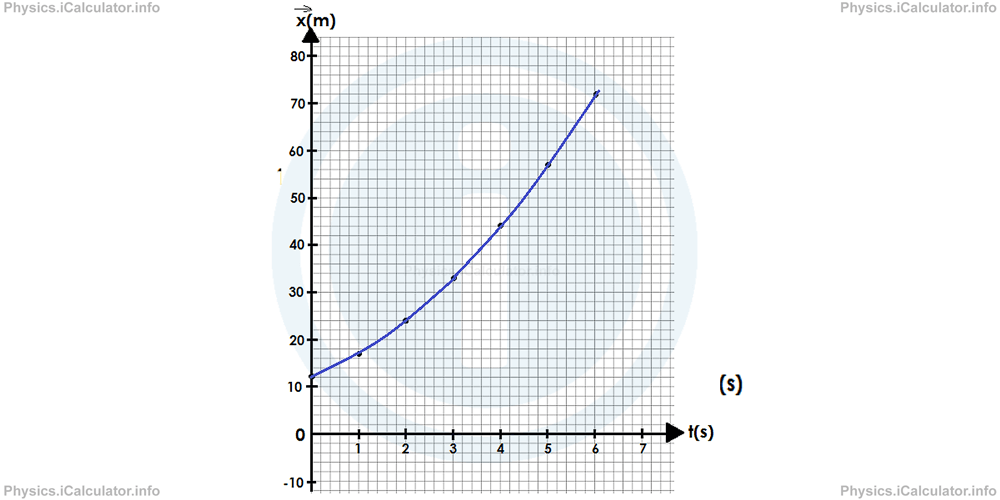
As you see, the graph is a positive (arms-up) parabola since the acceleration is positive (the object speeds up).
Now, let's consider a more complicated example in which multiple kinds of motion are involved.
Example 3
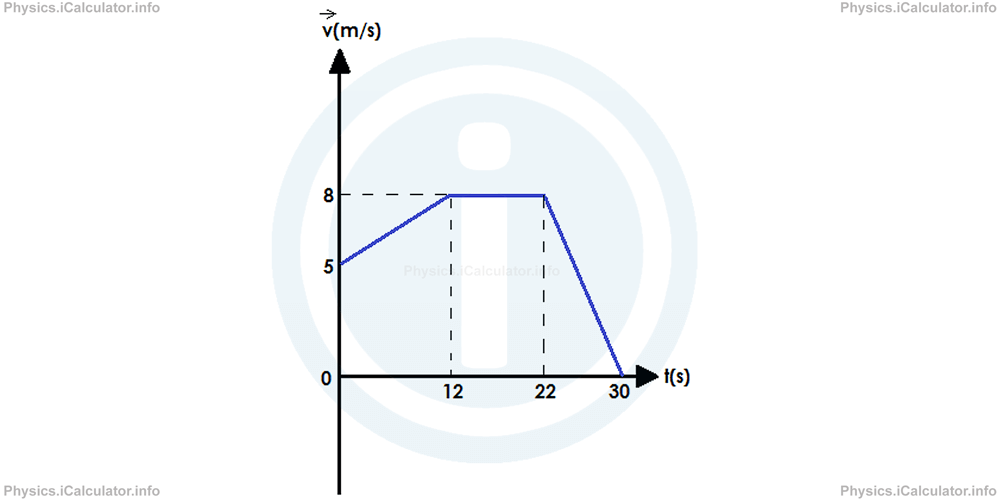
Plot the position vs time graph for the motion described in the velocity vs time graph shown below if initially the object was at x⃗0 = 30 m.
Solution 3
From the graph we can see the motion is composed by three parts: the first part (from 0 to 12 s) represents an accelerated motion; in the second part (from 12 s to 22 s) the motion is uniform; and in the third part (from 22 s to 30 s) the motion is decelerated (by the end of which the object eventually stops because the final velocity becomes zero).
a. In the first interval the approach is similar to that of the previous example. We have v⃗0 = 5 m/s, v⃗1 = 8 m/s, t1 = 12s. Therefore, we have for the acceleration a⃗1:
Therefore, the equation of motion for the first interval is
Substituting the values, we obtain
= 108 m
We can find some points in the graph to make the graph more accurate. We have
| t (s) | 3 | 6 | 9 | 12 |
|---|---|---|---|---|
| x⃗ = 30 + 5 × t + 0.25 × t2/2 | 46.125 m | 64.5 m | 85.125 m | 108 m |
We will insert later these points in the final graph.
b. In the second interval, the velocity is constant (v⃗1 = v⃗2 = 8 m/s). Therefore, we have
= v⃗1 × ∆t2
= 8 m/s × (22s - 12s)
= 8 m/s × 10s
= 80 m
This means by the end of the second interval the object will be at
= 108 m + 80 m
= 188 m
c. In the third interval, the motion is decelerated. The approach is the same as in the first part. The only difference is that here the initial position is x⃗2 = 188 m.
We have
The general equation of the third interval is
Substituting the known values, we obtain the specific equation of motion in the third interval,
or
Hence, at the end of the motion the object will be at
= 188 + 64 - 32
= 220 m
Again, we can use the table method to find some intermediate points in the graph to make its plotting more accurate. We have
| t (s) | 2 (24 - 22) | 4 (26 - 22) | 6 (28 - 22) | 8 (30 - 22) |
|---|---|---|---|---|
| x⃗ = 188 + 8 × t - 0.5 × t2 | 202 m | 212 m | 218 m | 220 m |
Now, let's insert all the above values obtained during the solution of this exercise in the same Position vs Time graph 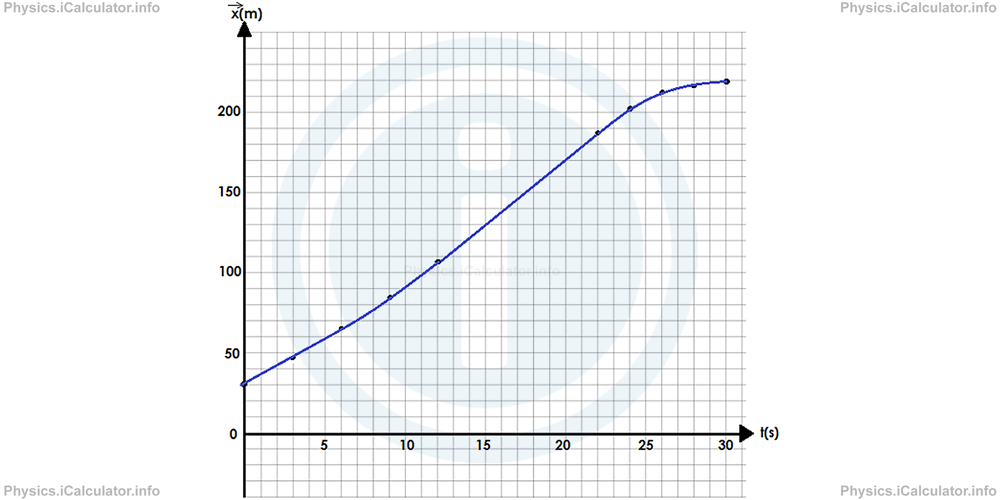
The Distance vs Time graph would be the same as the Velocity vs Time in this example as the entire movement has occurred only in the positive direction.
You have reach the end of Physics lesson 3.10.4 Speed verse Time graph in Uniformly Accelerated (Decelerated) Motion. There are 4 lessons in this physics tutorial covering Velocity v's Time and Speed v's Time Graph, you can access all the lessons from this tutorial below.
More Velocity v's Time and Speed v's Time Graph Lessons and Learning Resources
Whats next?
Enjoy the "Speed verse Time graph in Uniformly Accelerated (Decelerated) Motion" physics lesson? People who liked the "Velocity v's Time and Speed v's Time Graph lesson found the following resources useful:
- Uniform Speed Time Feedback. Helps other - Leave a rating for this uniform speed time (see below)
- Kinematics Physics tutorial: Velocity v's Time and Speed v's Time Graph. Read the Velocity v's Time and Speed v's Time Graph physics tutorial and build your physics knowledge of Kinematics
- Kinematics Revision Notes: Velocity v's Time and Speed v's Time Graph. Print the notes so you can revise the key points covered in the physics tutorial for Velocity v's Time and Speed v's Time Graph
- Kinematics Practice Questions: Velocity v's Time and Speed v's Time Graph. Test and improve your knowledge of Velocity v's Time and Speed v's Time Graph with example questins and answers
- Check your calculations for Kinematics questions with our excellent Kinematics calculators which contain full equations and calculations clearly displayed line by line. See the Kinematics Calculators by iCalculator™ below.
- Continuing learning kinematics - read our next physics tutorial: Acceleration v's Time Graph
Help others Learning Physics just like you
Please provide a rating, it takes seconds and helps us to keep this resource free for all to use
We hope you found this Physics lesson "Velocity v's Time and Speed v's Time Graph" useful. If you did it would be great if you could spare the time to rate this physics lesson (simply click on the number of stars that match your assessment of this physics learning aide) and/or share on social media, this helps us identify popular tutorials and calculators and expand our free learning resources to support our users around the world have free access to expand their knowledge of physics and other disciplines.